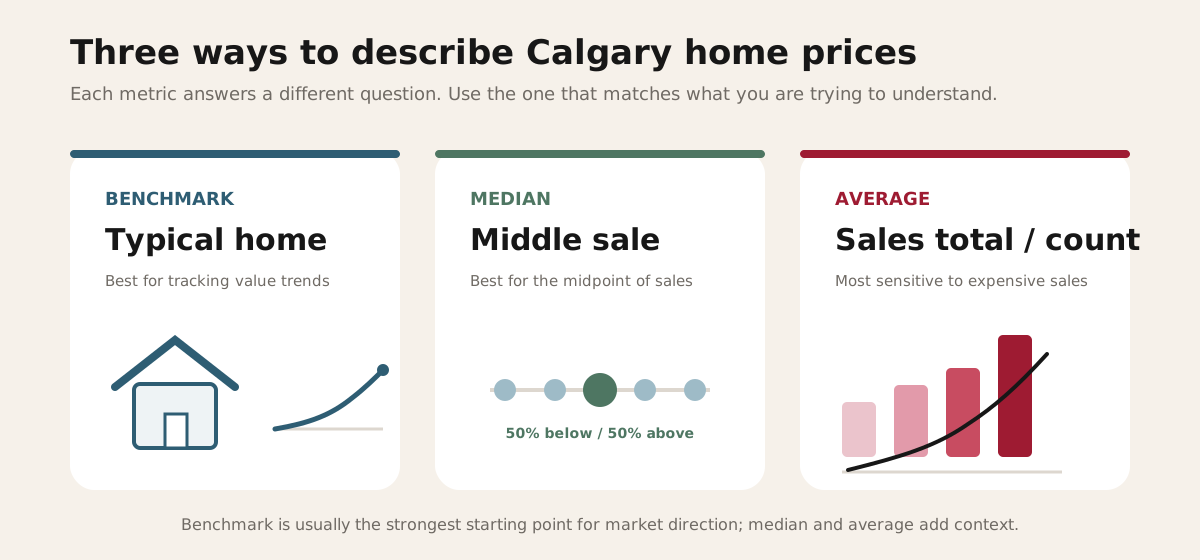
If you follow Calgary real estate, you have probably seen three different numbers used to describe home prices: benchmark, median and average.
They can be hundreds of thousands of dollars apart, and they can even move in opposite directions during the same month. That does not mean one of them is wrong. Each metric answers a different question.
For buyers and sellers, understanding that difference matters because using the wrong number can give you a distorted picture of what homes are actually worth — or where the market is heading.
A good example came in June 2026. Calgary's city-wide benchmark price was down 2.1% from the year before, the median was nearly flat, while the average price was up 3.6%. All three figures were accurate. They were simply measuring different things.
The Quick Difference
| Metric | What it tells you | Best use |
|---|---|---|
| Benchmark price | Estimated value of a typical home with typical characteristics | Tracking underlying price trends |
| Median price | The middle sale after all transactions are ordered by price | Understanding the midpoint of recent sales |
| Average price | Total dollar value of sales divided by number of sales | Understanding the arithmetic average and sales mix |
If your question is "Are comparable Calgary home values actually rising or falling?", the benchmark price is usually the strongest starting point.
If your question is "Where was the middle of the market this month?", the median is useful.
And if you want a broad calculation of the dollar value of everything that sold, the average can help — as long as you understand how easily the sales mix can move it.
What Is the Benchmark Price?
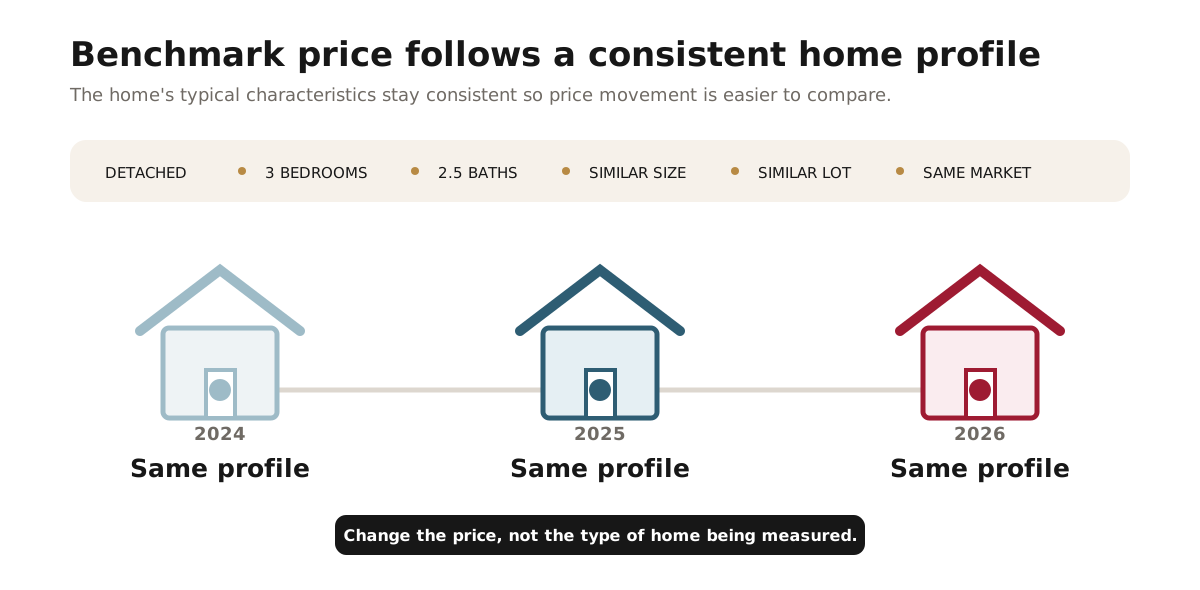
CREB® defines the benchmark price as the price of a typical home in an area. It is calculated using the MLS® Home Price Index.
Instead of simply averaging every property that happened to sell, the HPI models the value of a typical property using characteristics commonly found in that market. Those characteristics can include above-ground living area, lot size, number of bedrooms, number of bathrooms, property type, and other features commonly found in that location and housing segment.
The result is a statistical representation of a typical home rather than the price of one specific house. That makes the benchmark especially useful for comparing one period with another.
Why Benchmark Price Is Better for Tracking Market Direction
The type of homes selling in Calgary changes constantly. One month might have an unusually high number of luxury detached sales. Another might have more apartments and entry-level townhomes.
If you only look at average sale price, that change in the mix can make the market appear to rise or fall even if comparable properties have barely changed in value. The benchmark is designed to reduce that distortion.
Because it follows a consistent set of typical property characteristics, it is better suited to questions like: Are detached home values softening? Are condo prices falling faster than townhomes? Is Northwest Calgary outperforming another district? How has a typical home changed in value over the past year?
This is why benchmark pricing is such an important part of CREB® and CREA market reporting.
What Is the Median Sale Price?
The median is much simpler. Take every sale in a dataset, arrange the prices from lowest to highest, and select the one in the middle. If 101 homes sold, the 51st sale is the median. Half of the sales are above that number and half are below it.
A Simple Example
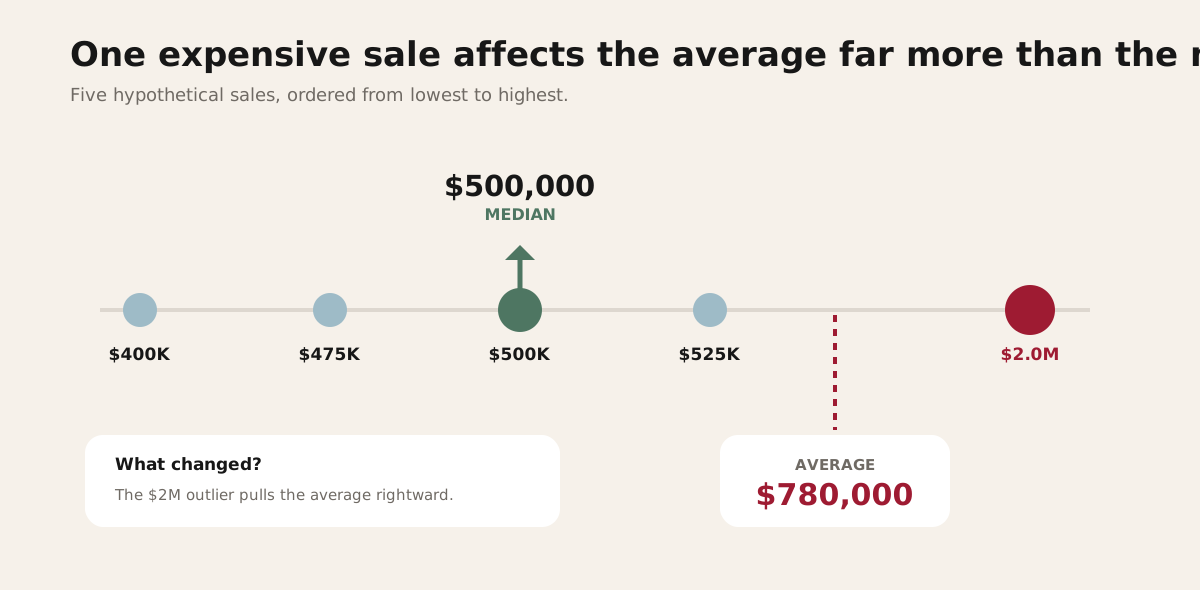
Imagine five homes sell for $400,000, $475,000, $500,000, $525,000 and $2,000,000. The median is $500,000.
The $2 million sale does not dramatically move the median because it remains just one observation at the top of the list. That makes median price much less sensitive to extreme sales than the average.
The Limitation of Median Price
Median price still does not control for what actually sold. Suppose Calgary has a month with more large detached homes and fewer starter properties. The median might rise simply because the mix of homes changed. That does not necessarily mean a comparable house became more valuable.
So median price is useful for understanding the middle of recent transactions, but it is not as strong as the benchmark for tracking the value of a consistent property over time.
What Is the Average Sale Price?
Average price is the easiest calculation: total value of all sales ÷ total number of sales = average sale price. If 100 homes sell for a combined $70 million, the average is $700,000.
The weakness is that every transaction affects the result according to its price. One very expensive sale can pull the average noticeably higher.
Using the five-sale example above:
| Sale | Price |
|---|---|
| 1 | $400,000 |
| 2 | $475,000 |
| 3 | $500,000 |
| 4 | $525,000 |
| 5 | $2,000,000 |
The median is $500,000. The average is $780,000. Four of the five homes sold below the average.
The math is correct. The average simply does not represent a "typical" transaction particularly well in this example.
A Real Calgary Example: June 2026
June 2026 shows exactly why these three metrics should not be treated as interchangeable. CREB® reported the following city-wide residential figures:
| Metric | June 2025 | June 2026 | Year-over-year |
|---|---|---|---|
| Benchmark price | $584,600 | $572,500 | −2.1% |
| Median price | $595,000 | $592,500 | −0.4% |
| Average price | $646,410 | $669,523 | +3.6% |
The benchmark declined. The median barely moved. The average increased. You can see the same month broken down by property type in the June 2026 Calgary market update.
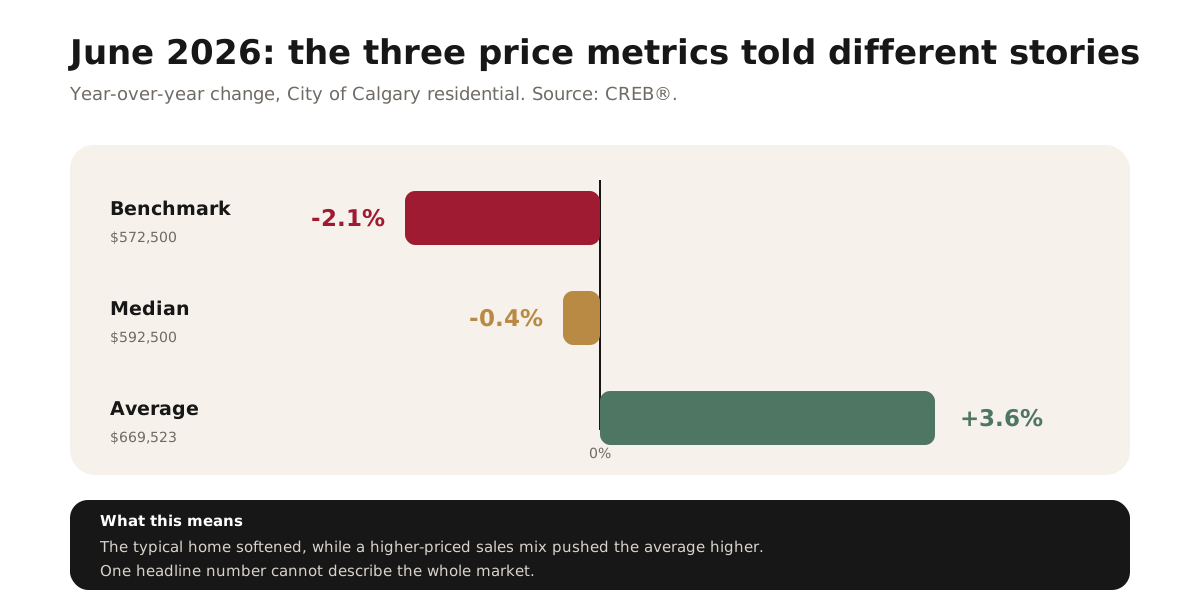
If you only saw the average price, you might conclude Calgary home values were rising. If you only saw the benchmark, you would conclude the value of a typical home had softened.
The most likely reason for the gap is the mix of homes being sold. A greater share of higher-priced transactions can lift the average even when the value of the benchmark property is declining.
That is why a headline saying "Calgary's average home price increased" does not automatically mean your home increased by the same amount.
Which Price Metric Should Buyers Use?
Buyers should generally use the benchmark to understand the direction of the market, then narrow the analysis to the property type and location they actually want.
A detached-home benchmark for Northwest Calgary is much more useful to someone shopping for a detached home in Tuscany than Calgary's overall average residential price.
For a serious home search, look at benchmark direction for the relevant property type, recent comparable sales, current competing listings, inventory and months of supply, and the condition and features of the specific property. If you would like help working through that, start with a buyer consultation.
The median can help show where recent transactions are clustering. The average is useful context, but it should rarely be the number that sets your buying budget.
Which Price Metric Should Sellers Use?
For sellers, market-wide statistics are useful for context but not for pricing one specific property. Your home's value depends on factors such as the exact community and location within it, property type, square footage, lot size, renovations, condition, basement development, garage, views or backing location, current competing inventory, and recent comparable sales.
If Calgary's detached benchmark is $700,000, that does not mean every detached home is worth approximately $700,000. The benchmark describes a typical property in a market segment.
A comparative market analysis brings that broad information down to the individual home — that is what a home evaluation is for.
Property Type Can Matter More Than the City-Wide Number
Another common mistake is looking at Calgary's total residential figure when you are interested in only one segment. Detached, semi-detached, row and apartment properties can behave very differently at the same time.
In 2026, Calgary's apartment market experienced much more price pressure than the detached segment. If you were selling a condo, a city-wide statistic that blended condos together with detached houses would hide a large part of the story.
Whenever possible, narrow the data by property type, district or community, and time period. Then compare the metrics.
How to Read a Calgary Market Report in the Right Order
A useful sequence is:
1. Start with the Benchmark Price
Look at the relevant property type and area. This gives you the clearest indication of underlying price direction.
2. Look at Inventory and Months of Supply
Price changes make more sense when you understand how much choice buyers have.
3. Check Sales and New Listings
These show how active demand and supply are.
4. Compare Median and Average Prices
If they are moving very differently from the benchmark, investigate the sales mix.
5. Use Comparable Sales for a Specific Property
Market statistics are context. Recent comparable transactions are what help determine the value of one particular home.
What Different Patterns Can Tell You
The relationship between the three metrics can itself reveal useful information.
Average rising faster than benchmark. Higher-priced properties may be making up a larger percentage of sales.
Average falling while benchmark stays stable. More lower-priced properties may be selling even though comparable values have not changed much.
Benchmark and median moving together. That can provide stronger evidence of broad market movement.
All three moving in different directions. That is a signal to look deeper into property type, location and the composition of sales before drawing conclusions.
The disagreement between the numbers is sometimes the most useful information in the report.
Frequently Asked Questions
Is benchmark price the same as average price?
No. Average price is total sales value divided by the number of transactions. Benchmark price estimates the value of a typical property using a standardized set of characteristics.
Which Calgary home price is most accurate?
There is no single "most accurate" metric for every question. Benchmark is generally best for tracking market value trends. Median is useful for the midpoint of recent transactions, while average reflects the arithmetic average of all sales.
Why can Calgary's average price rise while benchmark price falls?
The mix of properties sold can change. If more expensive homes sell during a particular period, the average can rise even while the value of a typical benchmark property declines.
Can I use the benchmark price to value my house?
Not by itself. Benchmark pricing is useful market context, but an individual home's value should be based on its features, condition, location, competition and recent comparable sales.
The Bottom Line
Benchmark, median and average prices are not three versions of the same number. They each tell you something different.
Benchmark price is generally the best tool for tracking underlying price trends because it follows a typical property's characteristics.
Median price shows the midpoint of the homes that actually sold.
Average price shows the arithmetic average of every transaction and is the most sensitive to changes in the mix of sales.
For Calgary buyers and sellers, the strongest approach is to use all three in context — while giving the benchmark, property type and comparable sales the most weight when making real decisions.
If you are trying to understand what the market data means for a specific Calgary property or neighbourhood, broad city-wide statistics are only the starting point.
Sources & Methodology
Definitions are based on CREB® housing-statistics methodology. The June 2026 Calgary figures in this article use CREB® city-wide residential statistics for June 2025 and June 2026.
Market statistics are provided for general informational purposes and should not be interpreted as an appraisal or valuation of a specific property.